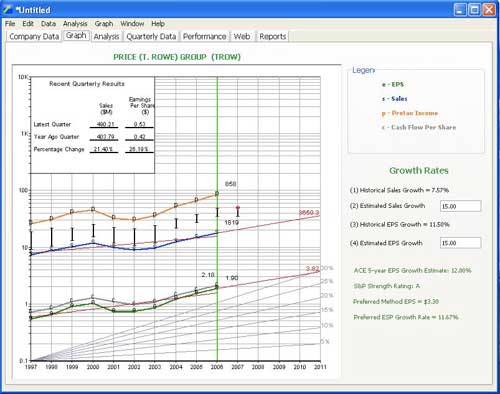
The company data graph is a key element of the stock analysis, and SIG makes it easy by plotting sales, pretax income, earnings, and (optionally) cash flow per share on a semi-logarithmic chart. Occasionally, companies will have an unusual occurrence or simply a bad year. SIG users can easily remove these outliers from consideration in the calculations by clicking on the year labels (at the bottom of the graph). The graph scale may also be expanded while various factors (pretax profit, sales, and cash flow per share) can be shifted up or down on the graph. Growth Calculations
SIG automatically calculates the average growth rates for both Sales and Earnings Per Share. Other calculations presented on this screen include the "Preferred Procedure" for estimating future EPS and S&P ACE Estimates for NAIC data service users. NEXT |
