Stock Analysis Software - Windows Features
Company Data Graph
 
BUY NOW
Shop our online store.
 
Testimonials
See what our customers say about the Stock Investment Guide.


Join Us on...
Twitter Logo
@Stock_XRay
 
 
See...
See all of the
great features of our analysis software.
MacintoshWindows
 
 
Try...
Download a free demo version of our software to see the features of our stock analysis software.
 
 
Learn...
We have updated the online tutorial originally by Doug Gerlach that will help you understand SIG's analysis.


Partners


Stock Investment Guide for Window
SIG for Windows
Graph Analysis Screen

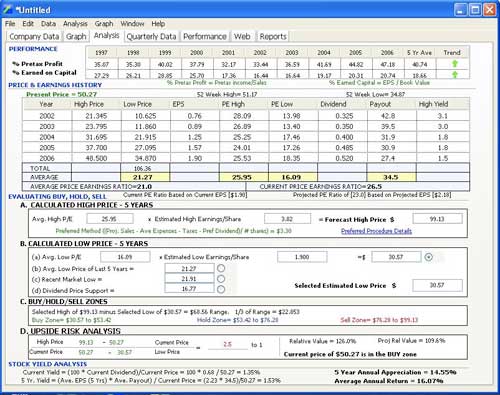
The company analysis screen is another key element of the stock analysis. Users use this screen to enter various human "judgments" to ultimately calculate Buy, Hold, and Sell zones. Outliers may be removed from various calculations by simply clicking on a cell (or the year label) of the Price and Earnings History data table, or a year label in the Performance table.

NEXT

See More...


* This site not affiliated with the National Association of Investors Corporation (“NAIC”) in any way,
nor does NAIC sponsor or endorse this web site or any of the products or services offered herein.
The author founded a successful investment club and has been a member of NAIC since 1990.

Stock Investment Guide, SIG, Portfolio Analysis Review, and PAR are trademarks
of Churr Software.


© Copyright 2015 Churr Software | A Taylor Media, LLC Website